Thermal Mapping and Sweat Metrics Reveal Breathability Trends in Basketball Jerseys
Erik Brooks · Oct 22, 2026
Thermal Mapping and Sweat Metrics Reveal Breathability Trends in Basketball Jerseys
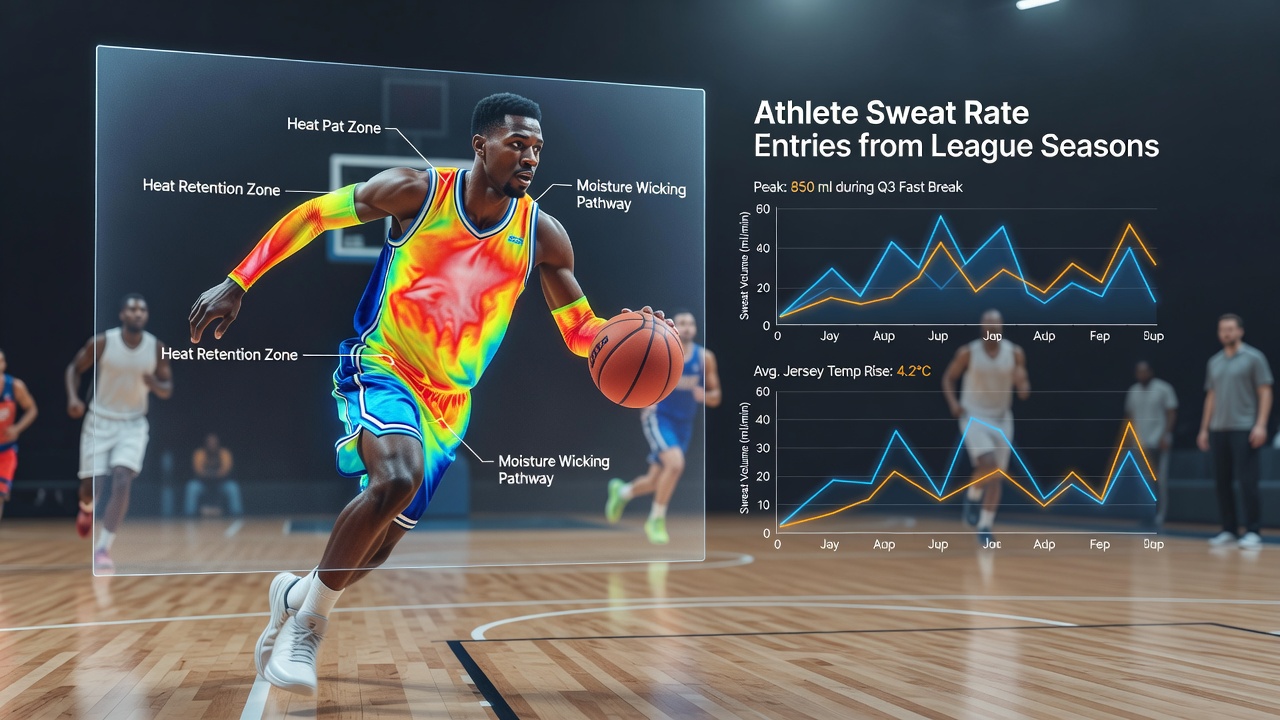
Researchers have combined thermal imaging with detailed sweat rate records to examine how basketball jersey fabrics manage heat and moisture during fast break drills, and league season data from multiple teams provide the baseline measurements for these evaluations. Studies conducted across professional and collegiate programs show that thermal cameras detect temperature variations across specific fabric zones while players execute repeated sprints, passes, and cuts, and those readings align with sweat volume entries logged throughout regular season schedules.
Thermal Imaging Protocols in Drill Sessions
Teams outfit players with standard jerseys fitted with reflective markers for camera calibration, then position infrared units along the court sidelines to capture continuous footage during fast break sequences that last between eight and twelve seconds each. Data collection occurs at fixed intervals, with cameras recording surface temperatures on the chest, back, and underarm panels where breathability claims are most prominent, while synchronized timers mark each transition from defensive setup to offensive push. Observers note that fabric areas with mesh inserts often register cooler readings within the first three repetitions, whereas denser knit zones retain heat longer before any visible dissipation begins.
League season entries supply the complementary sweat rate figures, which trainers calculate by weighing athletes before and after practice blocks and adjusting for fluid intake volumes recorded on sideline charts. When these numbers pair with thermal frames from identical drill days, patterns emerge around how quickly moisture leaves the garment versus how long elevated temperatures persist in high-movement zones.
Integration of Seasonal Sweat Data
Coaching staffs compile sweat rate logs across home and away games plus training camp periods, creating datasets that stretch from October through April and include variables such as game duration, ambient gym temperature, and player position. Analysts cross-reference these entries against thermal imaging runs performed midweek, allowing direct comparison between real-game perspiration totals and controlled drill heat maps. Figures from one multi-team study indicate that guards averaging 2.8 liters of sweat per game show faster temperature drops in ventilated back panels compared with forwards whose higher body mass produces sustained warmth readings even after identical fast break repetitions.
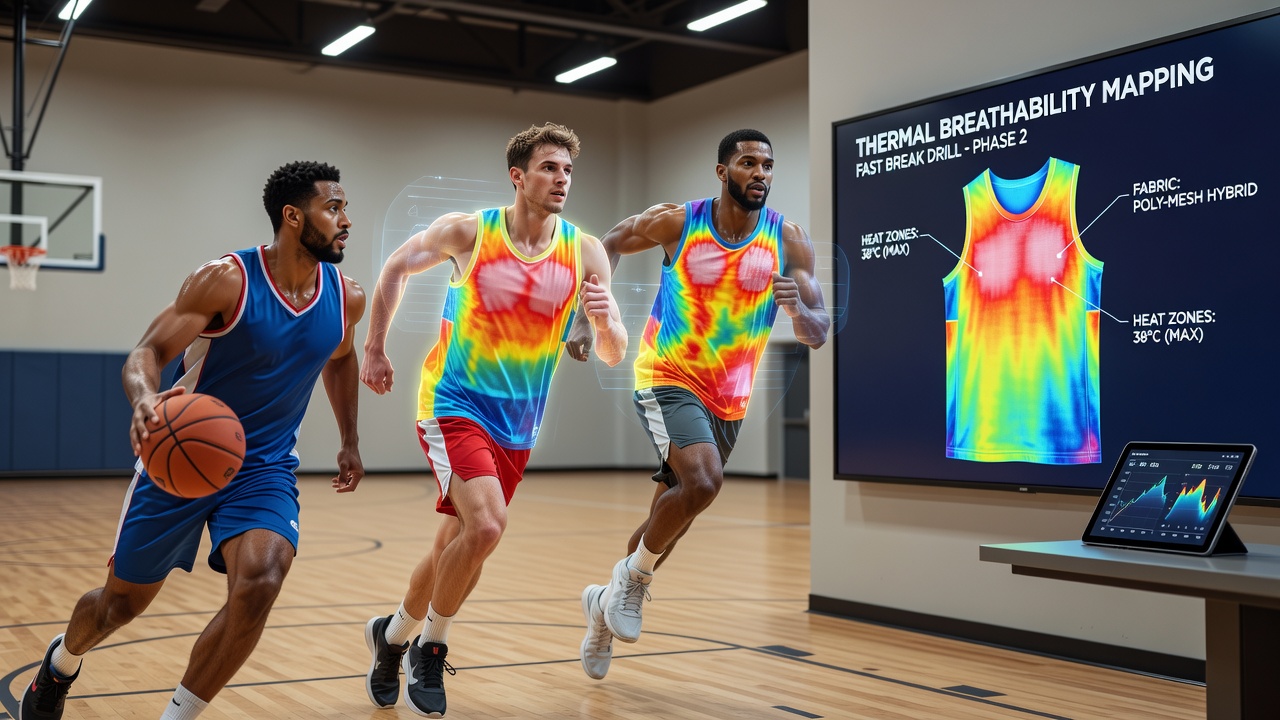
Equipment managers adjust camera angles to account for jersey stretch during lunging movements, ensuring that fabric deformation does not skew infrared values, and they repeat the process across multiple sessions to build statistical reliability. Researchers have observed that jerseys incorporating phase-change materials in targeted zones maintain more consistent temperature gradients when matched against historical sweat entries from humid arena conditions.
Observed Patterns Across Fabric Zones
Thermal data reveal that shoulder and upper chest regions often reach peak temperatures within the initial two fast breaks, yet mesh side panels demonstrate quicker recovery to baseline levels once players pause for substitutions. Sweat rate entries from the same athletes during league play show corresponding increases in fluid loss on days when ambient humidity rises above 60 percent, which correlates with slower overall heat dissipation in the recorded thermal sequences. Those who have reviewed aggregated results note that performance differences between polyester blends and newer recycled fiber constructions appear most pronounced after the fourth or fifth repetition of the drill set.
Additional measurements track how jersey fit influences airflow channels, with looser cuts allowing greater air exchange during lateral movements and tighter athletic fits concentrating heat along seam lines. League records from the 2025-2026 campaign, extending into October 2026 updates, provide further context when teams introduce revised uniform prototypes mid-season.
Equipment Calibration and Measurement Consistency
Calibration routines involve placing reference heat sources on the court before each session to verify camera accuracy within 0.5 degrees Celsius, while sweat scale readings undergo cross-checks against duplicate collection methods on alternate days. Data teams store both thermal video files and numerical sweat entries in shared databases that permit time-stamped alignment, enabling precise overlays of temperature contours onto garment diagrams. This process has produced repeatable mappings that identify which fabric constructions release heat most effectively under repeated high-intensity bursts.
Conclusion
Combined thermal imaging during fast break drills and seasonal sweat rate entries supply measurable indicators of jersey breathability performance across different fabric designs and player profiles. Ongoing collection through league schedules continues to refine these mappings, offering equipment developers clearer targets for future material adjustments based on documented heat and moisture patterns.